Executive Summary
Stuxnet is one of the most sophisticated pieces of malware ever discovered, often regarded as the first true cyber weapon. In this post, I dive into the memory analysis of a host infected with Stuxnet to uncover the stealthy techniques it used to evade detection for years. Memory analysis is a powerful tool in cybersecurity, allowing us to identify inconsistencies and gather evidence that isn’t accessible through other means.
Using Volatility 2 and 3, I analyzed a memory image obtained from my FOR508 course, which included bonus malware memory images for us to look at on our own. My focus was on identifying suspicious processes, starting with the unexpected presence of multiple lsass.exe processes. By examining these processes, I found signs of process hollowing and code injection—key indicators of malicious activity. Volatility’s apihooks and modscan plugins further revealed unusual system call hooks and suspicious drivers, particularly mrxnet.sys and mrxcls.sys, known to be part of Stuxnet’s toolkit [1].
This analysis underscores the importance of memory forensics in incident response. It highlights the need for comprehensive investigation techniques, as pulling the plug on an infected system can result in the loss of vital information. Memory analysis provides a unique, in-depth perspective on system compromise, essential for understanding and mitigating sophisticated threats like Stuxnet.
Introduction
Stuxnet was one of the first pieces of malware I learned about when I was learning about cyber security. Stuxnet is widely regarded as the first cyber weapon and used a variety of tactics to stay hidden. After getting my hands on a memory image of a host infected with Stuxnet, we take a look at some of the techniques this cyber weapon used to evade detection for many years. Memory analysis is one of the best places to identify malicious software. By studying the systems volatile memory you can identify inconsistencies in the system, bypass packers and obfuscators, and gather evidence that can’t be found anywhere else on the system. This is because everything in the OS needs to traverse the RAM including encryption keys, processes and threads, URLs, and even passwords. This is strictly a memory analysis post, which is only one part of analyzing malware, to get a full scope of the malware more investigation would need to be done on the host, such as analyzing files, host configuration changes, etc.
Memory Analysis using Volatility
The tool I will be using to conduct memory analysis will be Volatility 2 & 3 [2]. Some of the main differences between the two are Volatility 2 has to specify specific OS profiles and is a little more difficult to write on the command line with and has some additional plugins that were never ported over into 3. Volatility 3 is much simpler to write and use plugins with, but with that it loses some of the features and analysis capabilities that Volatility 2 had. For the remainder of this post, if you see vol2.py that is Volatility 2. Volatility 3 will be used on the command line as vol.py.
Our methodology for analyzing the processes in memory are going to be:
- Identify suspicious processes
- Analyze process objects
- Review network artifacts
- Look for signs of code injection
- Looking at suspicious drivers for signs of a rootkit
- Dump suspicious processes and drivers
You can learn more about this process in SANS FOR508 course [3].
Starting off with Volatility 2, we need to run a plugin to pull the suggested profile to use while running vol2.py, below you can see the output of the scan in Figure 1.
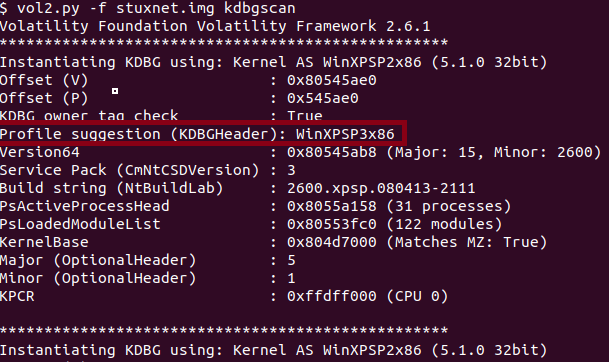
We will come back to this profile usage later, for now I will be using Volatility 3 to triage the image. The first thing I am looking for when analyzing an image is identifying malicious processes. Running vol.py -f stuxnet.img windows.pslist will output a list of processes running at the time the image was taken within the EPROCESS doubly linked list.
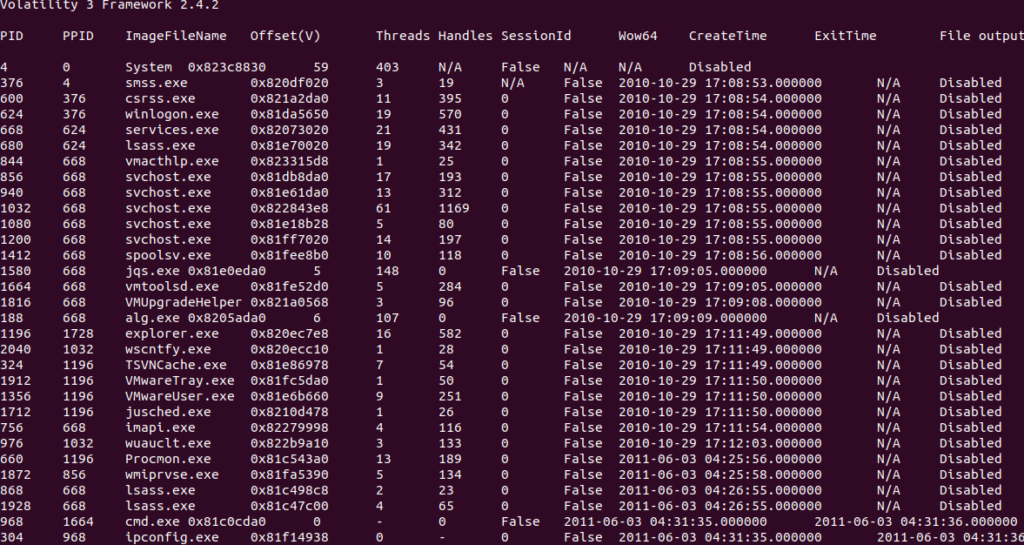
When analyzing the process list, we want to identify things that look suspicious, processes that shouldn’t be running on the system (for example maybe ipconfig.exe shouldn’t ever normally be run on the system), and we want to make a list of the processes that look suspicious for further investigation. Now keep in mind in this case I only have a memory image, not a full disk image of the host, therefore our analysis is limited.
Looking at the process list what are some processes that you find suspicious or any red flags that stick out?
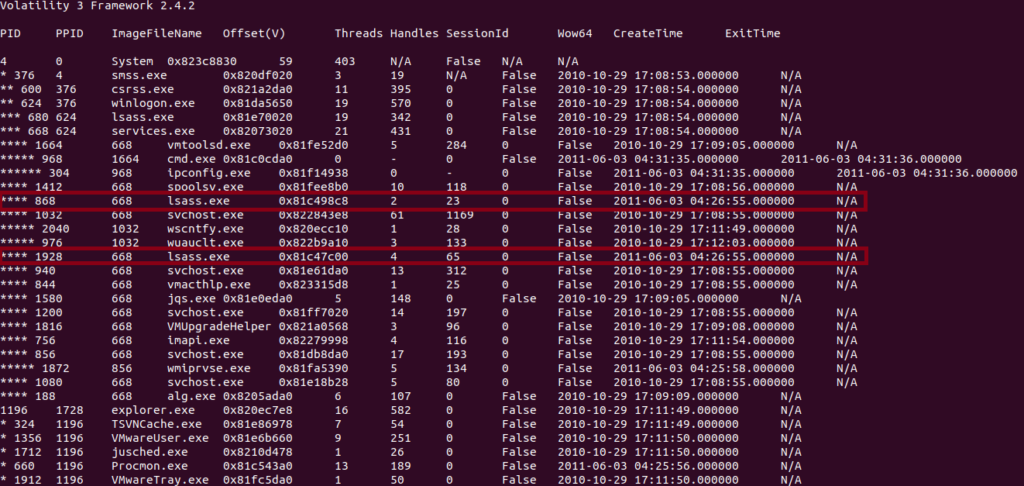
One of the things that catches my attention is the two lsass.exe processes at the bottom with PID(Process ID) 868 and PID 1928. Lsass.exe is responsible for authenticating users and is normally spawned as a child process under wininit.exe or winlogon.exe, it also starts at boot time so it should not be spawning minutes or hours later compared to other start up processes. We can see lsass.exe PID 680 has a PPID(Parent Process ID) of 624 winlogon.exe and starts within 3-5 seconds of system boot at 2010-10-29-17:08:53-17:08:56. Looking at the suspicious lsass processes we can see they have a much later Create Time at 2011-06-03 04:25:55, almost a year later. Their parent process is also services.exe PPID 668, which is also extremely unusual.
SANS has a great poster for identifying what’s normal on a system and can seriously help cut down on analysis time. Check out the SANS Hunt Evil Poster in the sources, you can see from the screenshot below in Figure 3, we can quickly identify suspicious processes by seeing what’s normal [4].

Running vol.py -f stuxnet.img windows.pstree we can get a better image of the parent and child process tree. Below in Figure 4 we can see services.exe spawns multiple lsass.exe processes.
Now let’s analyze these two process to see what other malicious indicators we can come up with. First, running the windows.cmdline plugin, this will display the process command lines from the Process Environment Block (PEB),
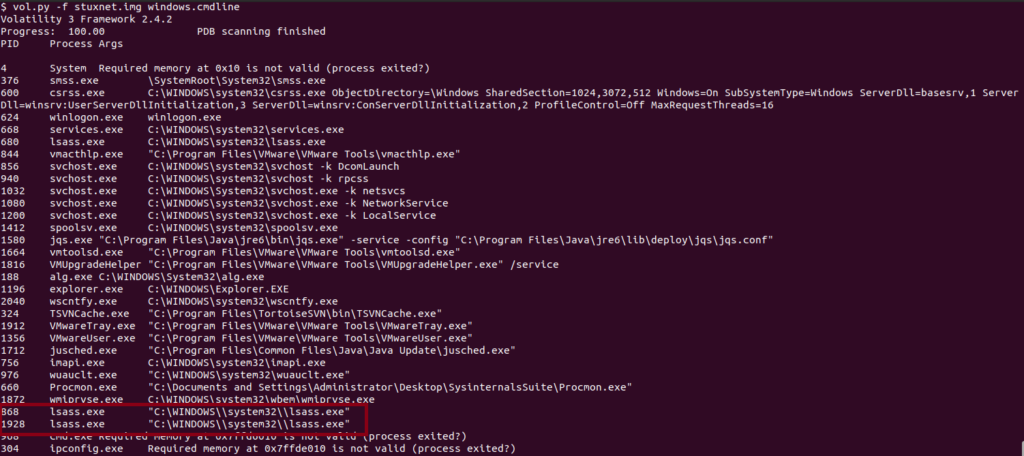
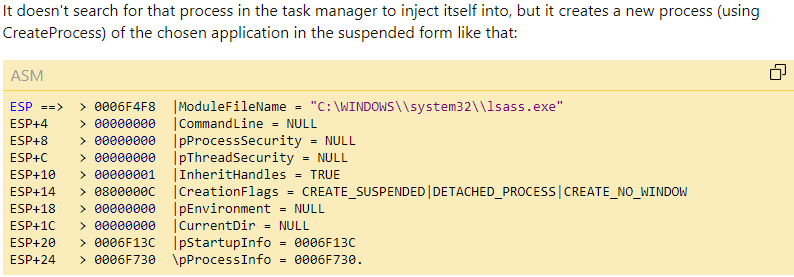
Above in Figure 5, we can see the two lsass processes in question have double backslashes in their command. This is another red flag and can be an attempt to bypass basic string matching detection methods. An article written by AmrThabet on codeproject confirms that this command is creating a new process in suspended form [5]. What this means is a process is being initialized in a paused state and does not immediately begin execution. This will allow the program to perform additional operations before the process is executed such as inject code.
Looking for network artifacts would be the next step but since this image was captured in a Windows XP OS it is not supported with the network plugins.
Now continuing to dig deeper into these processes and look for signs of code injection. Using the command vol.py -f stuxnet.img windows.ldrmodules --pid 868 1928 we look for DLLs that are unlinked in memory which can mean signs of code injection. The 4 columns to focus on are InLoadOrderModule list (InLoad), InInitializationOrderModule list (InInit), InMemoryOrderModule list (InMem), and MappedPath. This is all data pulled from the Process Environment Block (PEB).
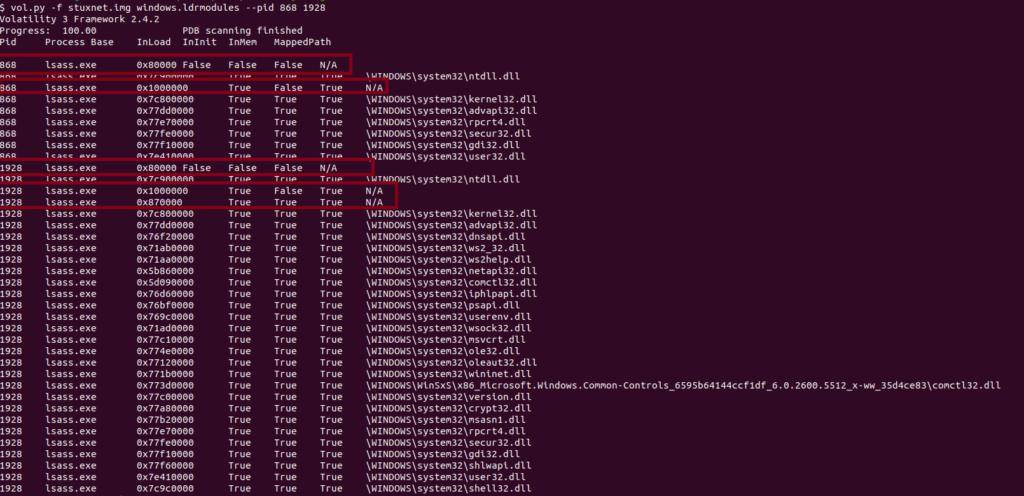
This list can be prone to false positives, for example lsass.exe shows False on the InInit column normally because executables are not initialized in the same way DLLs are. The thing to understand about MappedPath information is contents of the memory section are loaded via the Windows API, if this is missing it commonly means there was potentially code injected into the process. Here we can see in memory section 0x80000 we have False across the board and no mapped path, this is a strong sign of code injection. We also see memory section 0x1000000 has a False InInit which indicates this should be the executable, but it has no MappedPath which indicates process hollowing.
Process hollowing is where a process is created in a suspended state and then the attacker will inject their malicious code under the guise of the legitimate process. Now that we have identified signs of process hollowing lets use a Volatility 2 plugin called hollowfind. Using the command vol2.py -f stuxnet.img --profile=WinXPSP2x86 hollowfind we can see the output below in Figure 8.
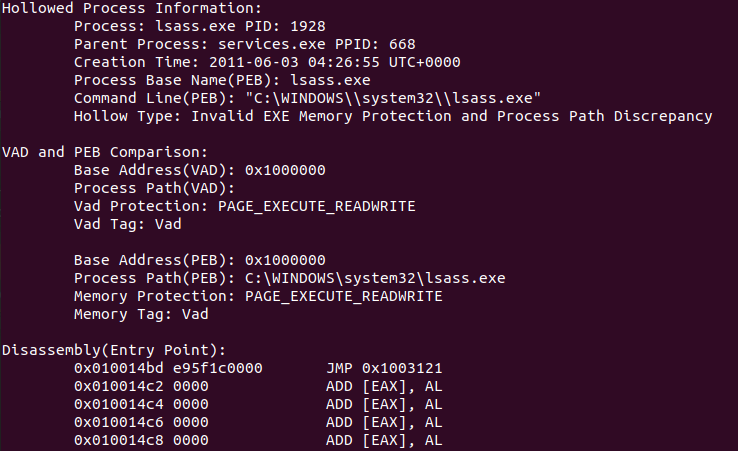

Here we can confirm a few things from the output above, first “Hollow Type: Invalid EXE Memory Protection and Process Path Discrepancy” means that this process does not have normal memory protections associated with legitimate executables. Normal legitimate executables have ‘READONLY’, ‘EXECUTE’, ‘READWRITE’, etc. PAGE_EXECUTE_READWRITE means this process has full read, write, and execute capabilities giving injected code full privileges to run. At the bottom of the output it shows the memory regions associated with the PAGE_EXECUTE_READWRITE protections which could be further investigated if you were a reverse engineer and knew Assembly.
Now that we have identified signs of process hollowing we can look for further signs of malicious activity by looking for signs of rootkit activity. Analyzing apihooks, DLLs, and drivers can lead to detection of deeper rootkit activity going on with in a host. Looking at a list of drivers, there can be hundreds and you almost certainly won’t be able to pick a malicious or suspicious one out of a list of that many. Let’s first use the apihooks plugin in Volatility 2 to identify any apihooks which will help narrow down the search of suspicious dlls or drivers to investigate, using the command vol2.py -f stuxnet.img --profile=WinXPSP2x86 apihooks -p 1928 868 some of the output is shown below in Figure 9.
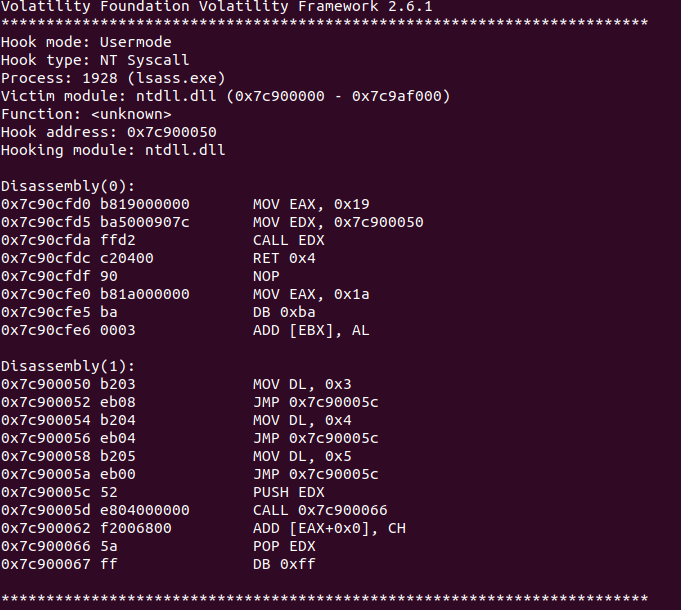
The output shows the hook mode, type, process, victim module, and the function. We used the -p to specify only to run apihooks on the 2 processes we have deemed suspicious, as this plugin can take an extremely long time to run on the entire memory image and is prone to a lot of false positives. We can see the ‘Hook mode: Usermode’ and ‘Hook type: NT Syscall’ meaning in Usermode the hooks intercept API calls made by user-mode applications and NT Syscall means the hooks are intercepting NT system calls. Legitimate applications rarely if ever need to hook system calls at the ntdll.dll level, a great short blog post by iredteam demonstrates some C++ code that can hook ntdll.dll and be used to evade EDR detection [6]. Hooking at the ntdll.dll allows the alteration of system functions, processes, or network activity. Another unusual thing to note is the multiple JMP commands in the Assembly language. This is telling the pointer to jump to a specific part of memory, which means it can redirect the flow of execution to execute malicious code.
Finally, we are going to use the modscan plugin to identify signs of malicious drivers. This part can be challenging if you are unsure at what your looking for as there can be upwards of a 100+ drivers in this output. Below is a snippet of the output vol.py -f stuxnet.img windows.modscan in Figure 10.
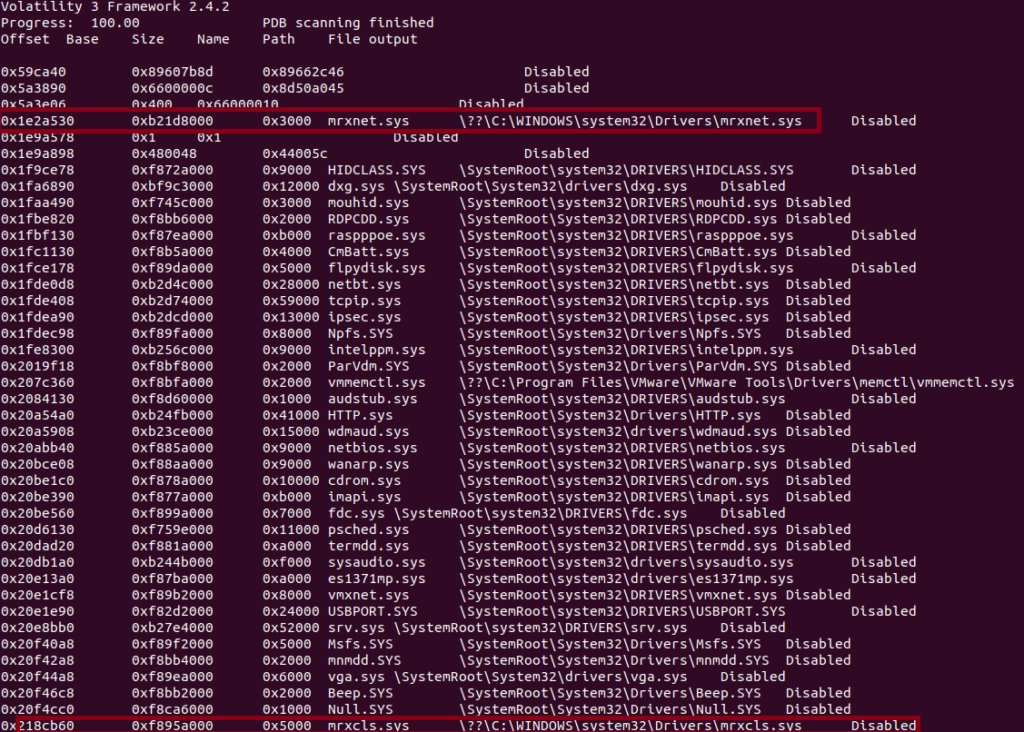
As you can see from the output above this is only some of the drivers listed in the scan and it is a lot to go through. If you are unfamiliar with the usual drivers seen in a Windows system there are a couple of great resources to use, Andrew Rathbun’s Vanilla Windows Reference is a repo that contains a recursive directory listings of a clean install of all modern Windows OS versions (unfortunately there is no XP listing so it doesn’t help here) [7]. Loldrivers.io is a curated list of Windows drivers used by threat actors to bypass security controls and an extremely useful website [8].
The two drivers I have highlighted above as suspicious is due to the path of the driver. Most drivers are located in the \SystemRoot\system32\Drivers folder but as we see above the mrxnet.sys and mrxcls.sys are located in \??\C:\WINDOWS\system32\Drivers, which warrant some further digging into these 2 drivers. According to a post by Mark Russinovich on Microsoft TechNet,
“Mrxnet.sys is the driver that the programmer originally sent me and that implements the rootkit that hides files, and Mrxcls.sys is a second Stuxnet driver file that launches the malware when the system boots. Stuxnet’s authors could easily have extended Mrxnet’s cloak to hide these files from tools like Autoruns, but they apparently felt confident that the valid digital signatures from a well-known hardware company would cause anyone that noticed them to pass them over [9].”

As we can see from Mark’s analysis, the drivers have real verified signatures from Realtek Semiconductor Corp, which makes this extremely dangerous and stealthy.
Conclusion & Why It Matters
We could go on further to extract the processes, drivers, and objects from memory and analyze them further which I may do in another post. The insights we can gleam from memory analysis are vast. It gives you an inside look at the system in a way that no file system or MFT record can. It is absolutely crucial in incident response and is one of the reasons you should never pull the power cable on a system you believe may be infected with malware. This could lead to loss of critical information on the malware and how it affected the system. Another thing to note is that this is just a snapshot taken of the memory at that point in time, RAM is volatile and is changing all the time things can be missed here depending on the time the image was taken.
If you are interested in reading more about Stuxnet and cyber weapons like it I highly recommend Andy Greenberg’s book “Sandworm” and “Countdown to Zero Day” by Kim Zetter.
Sources
- https://malware.news/t/stuxnet-drivers-detailed-analysis/10822
- https://github.com/volatilityfoundation
- https://www.sans.org/cyber-security-courses/advanced-incident-response-threat-hunting-training/
- https://www.sans.org/posters/hunt-evil/
- https://www.codeproject.com/Articles/246545/Stuxnet-Malware-Analysis-Paper#ch4.3
- https://www.ired.team/offensive-security/defense-evasion/how-to-unhook-a-dll-using-c++
- https://github.com/AndrewRathbun/VanillaWindowsReference/tree/main
- https://www.loldrivers.io
- https://techcommunity.microsoft.com/t5/windows-blog-archive/analyzing-a-stuxnet-infection-with-the-sysinternals-tools-part-1/ba-p/724029
